An Integrated Financial Model (IFM) captures a business’ streams of information to collate data for tracking visibility.
it’s the starting point for aligning the day-to-day activities of a company with its long-term goals. The IFM works by collecting data from all the systems used to run one’s business. Trends are then are evaluated to make predictions which are then discussed with the team involved and aligned with the business’ goals. When fully implemented, an IFM can accurately report on every relevant metric every week.
In our experience, use the Integrated Financial Model and our conversations to make charts and tell stories about the progress and value of your business. We’ve been applying this methodology across hundreds of businesses since 2001, working with some great people working on great ideas.
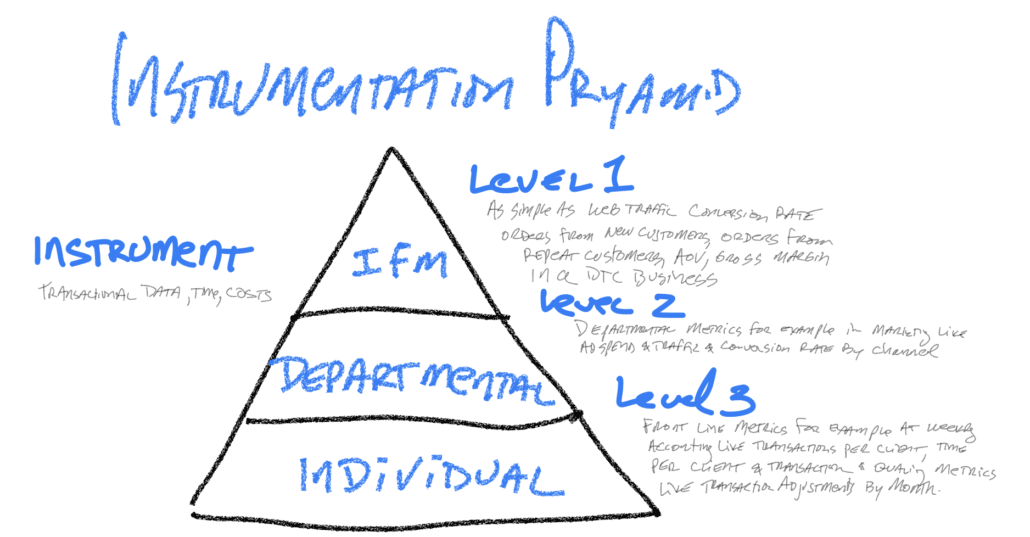
The Instrumentation Pyramid
Level 1 – The Vital Signs
Vital Signs are the minima required set of metrics to accurately predict the business. In a direct-to-consumer business that we studied at Assembled Brands the Level 1 metrics were ad spend, web traffic, conversion rate, average order, repeat purchase rate product margin, gross margin. From these metrics, we can calculate the LTV:CAC ratio.
Level 2 – The Metrics
- break the web traffic metric from Level 1 into sources of web traffic
- break the gross margin down into margin by product
- break the LTV into cohorts
Level 3 – The real-time transaction metrics of your business.
The fractal: Each department, each customer, each employee may also have 3 levels of metrics.


